

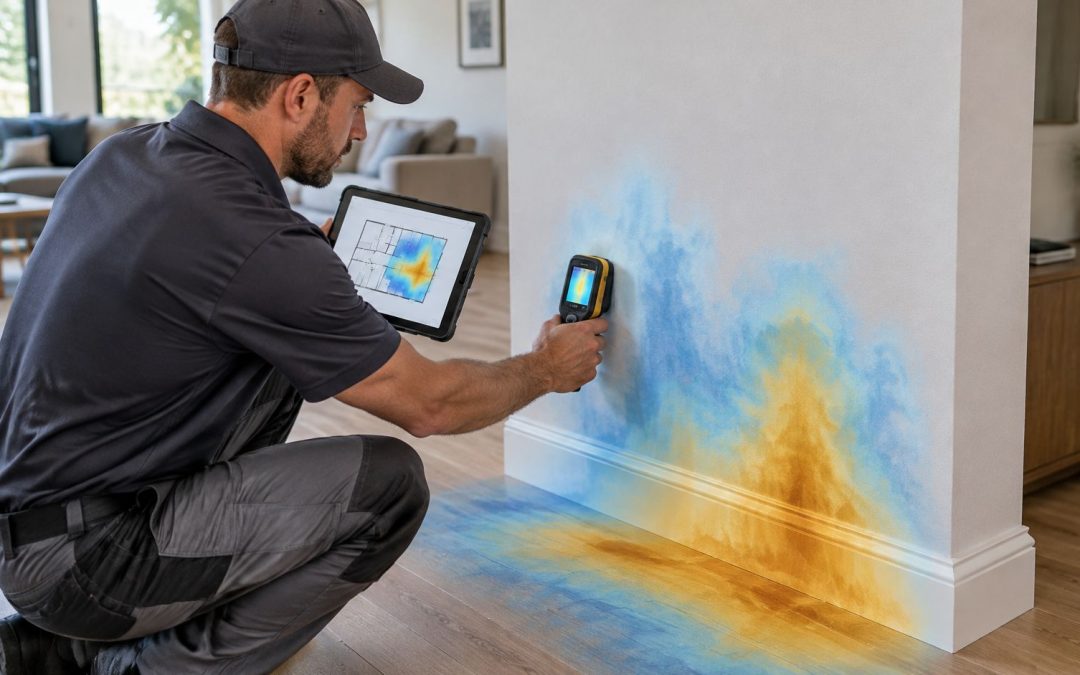
Moisture mapping is the systematic measurement and documentation of moisture across building materials after water intrusion, recorded at fixed points so drying can be tracked over time.
You've cleaned up the water, the floor looks normal, and the baseboard feels dry. But you're still wondering whether water reached beneath the flooring or behind the wall. For Florida homeowners, the useful question isn't just what is moisture mapping, but how it helps distinguish a property that looks dry from one that has fully dried.
What Moisture Mapping Is and Why It Matters
A plumbing leak soaks your kitchen wall. You wipe the floor and dry the painted surface, and the room looks ready to use. Moisture can still sit inside the wall assembly and under the subfloor, where your eyes and hands never check.
A moisture map works like a weather map for your home: one reading is a thermometer, but readings taken across the whole affected area show where conditions change and which way the water migrated. A technician checks materials at fixed locations and records each result against its position, so wet, drying, and dry zones appear on the plan instead of living in a guess.
A floor plan with evidence attached
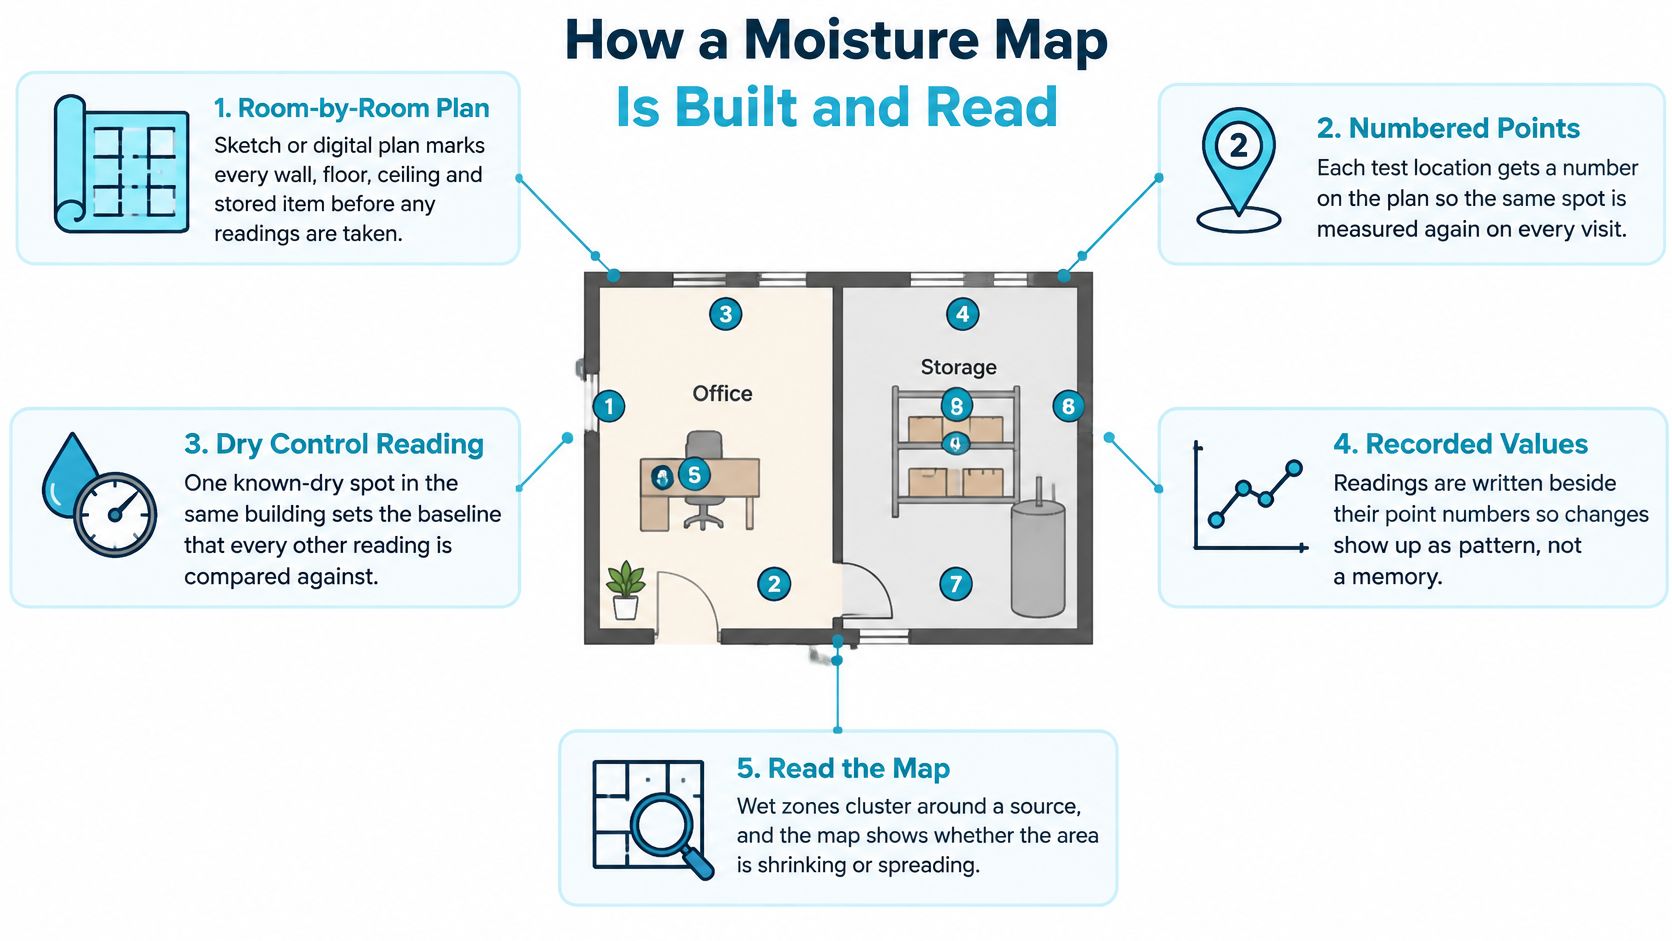
Technicians first establish a dry baseline, a reference reading taken from comparable, unaffected material in the same home. Every wall, floor, ceiling, and contents reading is then compared to that baseline, which is what lets a map sort areas into wet, potentially affected, and unaffected.
One caution about the colors on that plan. A map shows readings at specific points, under specific conditions. In Florida heat and humidity, a surface can read near baseline while material a few inches deeper stays wet. Proof of dryness comes from readings that hold at baseline across repeated visits, supported by the environmental measurements, photographs, and equipment records that water-damage restoration standards describe for documenting drying decisions and insurance communication.
Moisture mapping turns hidden water migration into a measurable floor plan.
In Bradenton, Sarasota, and surrounding Gulf Coast communities, stormwater, plumbing failures, and HVAC problems push moisture beyond the original room. Hidden water often leaves no visible stain, so recognizing signs of hidden water damage behind drywall helps you act sooner.
The practical benefit is a shared record. Your restoration technician, repair contractor, and insurance adjuster work from documented conditions rather than different impressions of what got wet. AMPM Restoration Services begins water damage work with an assessment using advanced diagnostic equipment to evaluate how far water penetrated, so the map starts from measured conditions.
Instruments Behind Every Moisture Reading
Every color on a moisture map traces back to a physical measurement, and each instrument reads a different slice of the problem. A meter that measures air cannot tell you what is happening inside a wall, and a camera that sees surface temperature cannot confirm water content. Knowing which tool produced each number is the first step toward trusting, or questioning, the map.
Moisture mapping instruments and what each one measures
| Instrument or test | What it measures | Best use in a map | Main limitation |
|---|---|---|---|
| Pinless moisture meter | Moisture near the surface, without penetrating the material | Fast screening of walls, floors, and ceilings | Readings depend on the material scale selected |
| Pin-type moisture meter | Electrical resistance at the depth of the pins, interpreted as moisture | Localized readings in wood and framing | Pin contact, salts, or metal can distort results |
| Thermal imaging camera | Surface temperature differences that may suggest moisture | Finding cool areas that need investigation | Supplemental only; doesn't measure moisture content |
| Hygrometer or psychrometric meter | Air temperature, relative humidity, and dew point, depending on the instrument | Checking the room's drying conditions | Measures air, not material |
| In-situ slab relative-humidity probe, ASTM F2170 | Relative humidity inside concrete | Slab drying and flooring-installation decisions | Requires drilled probes and an equilibration period |
| Electronic concrete screening meter, ASTM F2659 | Comparative readings across the slab surface | Locating wet areas and choosing probe locations | Isn't equivalent to an internal relative-humidity test |
The limitation column matters as much as the measurement column. In a humid Florida summer, a thermal camera will flag a cool patch around an air-conditioning duct just as readily as a wet stud bay, because evaporation is only one way a surface gets cold. A pinless meter pressed against dense material can report a high reading on the wrong scale. Each of those false signals can end up shaded onto a map if nobody confirms it with a second instrument.
So the tools work in sequence. A pinless meter sweeps the wall quickly and flags a suspicious band, then a pin meter investigates a specific spot in accessible framing. The thermal camera decides where to look first, and our explanation of thermal imaging leak detection describes why temperature patterns still need confirmation with other measurements. During a water damage assessment, AMPM Restoration uses advanced diagnostic tools to gauge moisture levels, then keeps monitoring them while drying equipment runs.
When concrete needs a deeper test
Concrete shows why surface screening falls short. A slab can read dry on top while holding moisture deeper inside, which matters before anyone installs flooring that could trap vapor.
The IICRC S500 technical overview points to the ASTM F2170 procedure for these slab decisions: probe holes reach 40% of slab depth when the slab dries from one side, or 20% when it dries from both, the probes equilibrate for 24 hours before readings are taken, and the test layout uses three probes in the first 1,000 square feet plus one additional test for each subsequent 1,000 square feet.
That depth detail answers the question homeowners ask most: why drill at all? Surface conditions reflect recent weather and indoor air conditioning, while an internal probe reports what the slab will keep releasing after the floor covering goes down. The drilling, depth, and timing belong to the technician performing the test, matched to the slab and the installation requirements.
The screening meter locates the wet zones worth probing. The internal probe answers whether the slab is dry enough for flooring. A map built on only one of them can look complete while missing half the story.
How a Moisture Map Is Built and Read
A useful moisture map starts with a room-by-room sketch or digital floor plan. Numbered locations identify the wall, floor, ceiling, or item being checked, while a legend explains the symbols and shaded areas.
Behind each colored zone should be an actual record: material, instrument, measurement mode, exact location, date, time, and result. Photographs connect those records to recognizable features in the room.
Follow a kitchen-wall example
Suppose a supply-line leak wets the kitchen wall. The technician labels test locations K1 through K12 across the suspected wet band and selects unaffected drywall elsewhere in the room as a control.
The plan should show whether each point is near the baseboard, beside a cabinet, or farther up the wall. Otherwise, someone returning later might check a different spot and mistake that difference for drying progress.
An environmental record adds air temperature, relative humidity, dew point, and equipment placement. Dew point is the temperature at which moisture in air can condense on a surface.
The assessment and recording sequence
Assess water penetration. At AMPM Restoration, our water damage process starts with advanced diagnostic equipment to evaluate how far water has penetrated and identify the most affected areas. Locating the source may also require appropriate leak detection methods.
Set control readings. Measure comparable, unaffected materials. A dry drywall reference won't substitute for a wood-framing reference.
Sketch and label the locations. Mark the kitchen points clearly enough that another technician could find them. Include adjoining rooms when the suspected migration path extends beyond the kitchen.
Measure consistently. Use the same instrument and appropriate mode on return visits. Record the substrate and any access limitations, such as flooring beneath fixed cabinets.
Record air conditions. Note temperature, humidity, and drying-equipment placement. These details help explain why a particular area is progressing or lagging.
Photograph each zone. Tie images to location labels instead of keeping an unlabeled collection of close-ups. Include a wider view so the location remains recognizable.
Begin appropriate action promptly. The EPA mold course advises that damp or wet materials should generally be removed, cleaned, or dried within 24 to 48 hours to reduce the likelihood of mold growth. Documentation shouldn't delay necessary mitigation.
Repeat and compare. Track the same points during drying. Investigate readings that remain high, spread into adjacent areas, or stop improving rather than adding another day of equipment use.
A shrinking shaded area can be encouraging, but only if comparable readings support the change. Switching instruments or skipping the control reading can make a tidy-looking map difficult to interpret.
Before accepting the documentation, check for a baseline, a legend, repeated locations, and dated readings. Those details make the map useful after the technician leaves.
Reading Moisture Numbers Without Getting Misled
A red patch over a baseboard can look like a verdict. Treat it more like a weather map: the color shows where the instrument found a strong signal, while the diagnosis still has to name the material, the depth, and the cause.
Meters commonly infer moisture from electrical properties rather than measuring water directly. Salts, nearby metal, temperature, surface contact, material density, and calibration can move the display. Under Florida heat and humidity, a surface can feel dry to the hand while the reading behind paint or inside a cavity tells a different story.
The National Institutes of Health technical bulletin on unwanted building moisture recommends comparing suspect locations with controls made of the same material and recording where and when measurements were taken.
Material scales aren't interchangeable
The wood and drywall examples below come from the EPA's moisture-meter guidance, which describes wood readings below 15% as dry and above 17% as wet, and drywall examples of approximately 0.5% and 1%, respectively. Use them as scale-specific examples rather than universal clearance limits.
Dry and wet reading guidance by material
| Material | Scale or test | Dry reading | Wet reading | Compare with |
|---|---|---|---|---|
| Wood framing | Wood moisture-content scale | Below 15% in the cited example | Above 17% in the cited example | Unaffected wood of the same species |
| Drywall or wallboard | Drywall scale | About 0.5% in the cited example | About 1% in the cited example | Unaffected wall of the same board type |
| Concrete slab | In-situ relative humidity, ASTM F2170 | Meets the flooring system's specified limit | Exceeds the specified limit | Flooring manufacturer's installation limit |
| Brick | Appropriate brick mode | Comparable to an unaffected reference | Higher than that reference | Unaffected brick in the same wall |
Many meters are calibrated for wood, so a displayed percentage on plaster or gypsum board does not automatically equal actual moisture content. The device's material mode and instructions decide what that number means.
Practical rule: Judge a reading against its material, measurement method, and baseline, not a single percentage or color.
A wide shaded area can mean light moisture spread across drywall; a small dark spot can mean one saturated stud bay. Read area, depth, and material together. A dry surface reading leaves concealed moisture unresolved.
For related mold concerns, a clear mold inspection report should separate moisture observations from mold findings, since each needs different evidence.
Knowing When a Mapped Building Is Actually Dry
A map can show the "right" color before the building is dry. In a Florida summer the air conditioner can pull the damp feel off a painted surface in an afternoon, so the wall reads calm and looks finished while the framing behind it still holds water. Surface condition is the weather; assembly moisture is the climate. Judge the climate, not the weather.
Indoor humidity levels and what they mean for drying
| Indoor relative humidity | What it means for drying | Guidance source |
|---|---|---|
| 30% to 50% | The ideal indoor moisture-control range; keeping toward the lower half also helps control mold and dust mites | Florida Department of Health mold guidance, citing the U.S. EPA |
| Above 60% | Past the recommended indoor ceiling; humid air can hinder drying and favor mold | Florida Department of Health |
| Above 70% | Enough vapor can be present to moisten the building materials themselves | Massachusetts public-health guidance on moisture-measuring devices |
Room air sets the ceiling on how fast wet materials can release water. If the indoor air sits humid, even a wall that is technically drying can stall, because the moisture has nowhere to go.
Check the assembly, not its appearance
A wall can feel dry while underlying materials remain wet. After water removal and extraction, we monitor moisture during drying to make sure every part of the home reaches acceptable dryness standards.

Florida's heat and humidity complicate that judgment. Air-conditioning behavior can create condensation that resembles a leak, and salt-contaminated coastal materials can complicate electrical meter readings. A meter can tell you a spot is wet; it cannot tell you whether that wetness came from yesterday's spill, a still-active pipe, or a humid room condensing on a cold surface.
Technicians have to separate an active leak from residual moisture or recurring condensation. When growth is already visible, routine sampling adds little; the useful work is finding and correcting the moisture source.
Completion test: Material readings meet appropriate drying targets, those results hold, indoor humidity is controlled, and the source has been corrected.
Readings should decline during drying, then stabilize near the appropriate baseline. They do not need to keep falling indefinitely.
Six Questions About Moisture Mapping Answered
Homeowner questions
Does moisture mapping damage walls or floors?
Barely, if at all. Pinless meters scan the surface without disturbing the finish. Pin-type meters leave two small probe marks where they test, and technicians reserve them for spots where a reading needs to reach inside the material.
How long does moisture mapping take?
The first visit produces the map itself, typically in a single appointment. The monitoring phase lasts as long as drying does. One wet wall in an open room resolves faster than water that spread through several rooms, soaked dense materials like hardwood or plaster, or settled into cavities a technician can only reach from one side. The process wraps up when readings hold at the acceptable baseline across visits.
How often are moisture readings repeated?
The schedule follows the repeat-and-compare method described earlier: same marked points, same meter settings, so each visit shows real change instead of measurement noise. Checks come sooner when a section stops improving, because that is where the drying plan gets adjusted.
Understanding the limits
Can a homeowner create a moisture map?
You can record visible conditions and use a basic meter or humidity gauge to flag concerns. Reliable interpretation still requires the correct material settings, comparable control readings, and an understanding of areas the instrument can't reach.
Can a moisture map show mold?
It can identify concealed wet zones where mold may develop, but it doesn't confirm mold by itself. A suspicious moisture pattern calls for investigation rather than labeling every high reading as mold growth.
What should happen immediately after water damage?
Arrange safe assessment, source control, water removal, and appropriate cleaning or drying promptly. Establish the initial moisture record before conditions change when practical, but never postpone urgent mitigation just to finish paperwork.
Schedule Your Free Moisture Map Inspection Today
If water has reached a wall, floor, or ceiling in Bradenton, Sarasota, Palmetto, St. Petersburg, or anywhere in the greater Tampa Bay area, a moisture map shows how far it traveled. A surface can dry fast under Florida heat while framing and insulation behind it stay damp, so a clean-looking wall is not proof the building is dry.
AMPM Restoration is locally owned, licensed, bonded, and insured, and available 24/7 with a one-hour response time across the Suncoast. The IICRC-certified team uses advanced diagnostic tools to gauge moisture levels during the assessment, then keeps monitoring readings during drying until every part of the home reaches acceptable dryness standards.
Local help from assessment through reconstruction
Services cover water damage restoration, mold inspection and testing, mold removal and remediation, fire damage restoration, storm and flood cleanup, leak detection, sanitization, repairs, and final restoration for homes, offices, and commercial sites. AMPM coordinates directly with your insurance carrier, and financing options are available, so the claims side moves as quickly as the drying.
Call anytime, day or night, or visit AMPM Restoration Services to schedule your free inspection and estimate. The earlier the baseline map is recorded, the sooner every drying decision rests on documented readings instead of guesswork.
